

Business Intelligence
Cloud-based, Power BI-driven reporting for clarity and measurable impact
Automated reporting, reduced manual effort, and smarter decisions powered by data – all at your finance and operations teams’ fingertips.
With the experience from hundreds of reporting projects and a strong focus on usability, UI/UX, and data storytelling, we make sure that Power BI truly delivers – turning connected data into timely, reliable, and actionable insights across finance, sales, production, supply chain, and beyond.
Rethink how you work with business data.
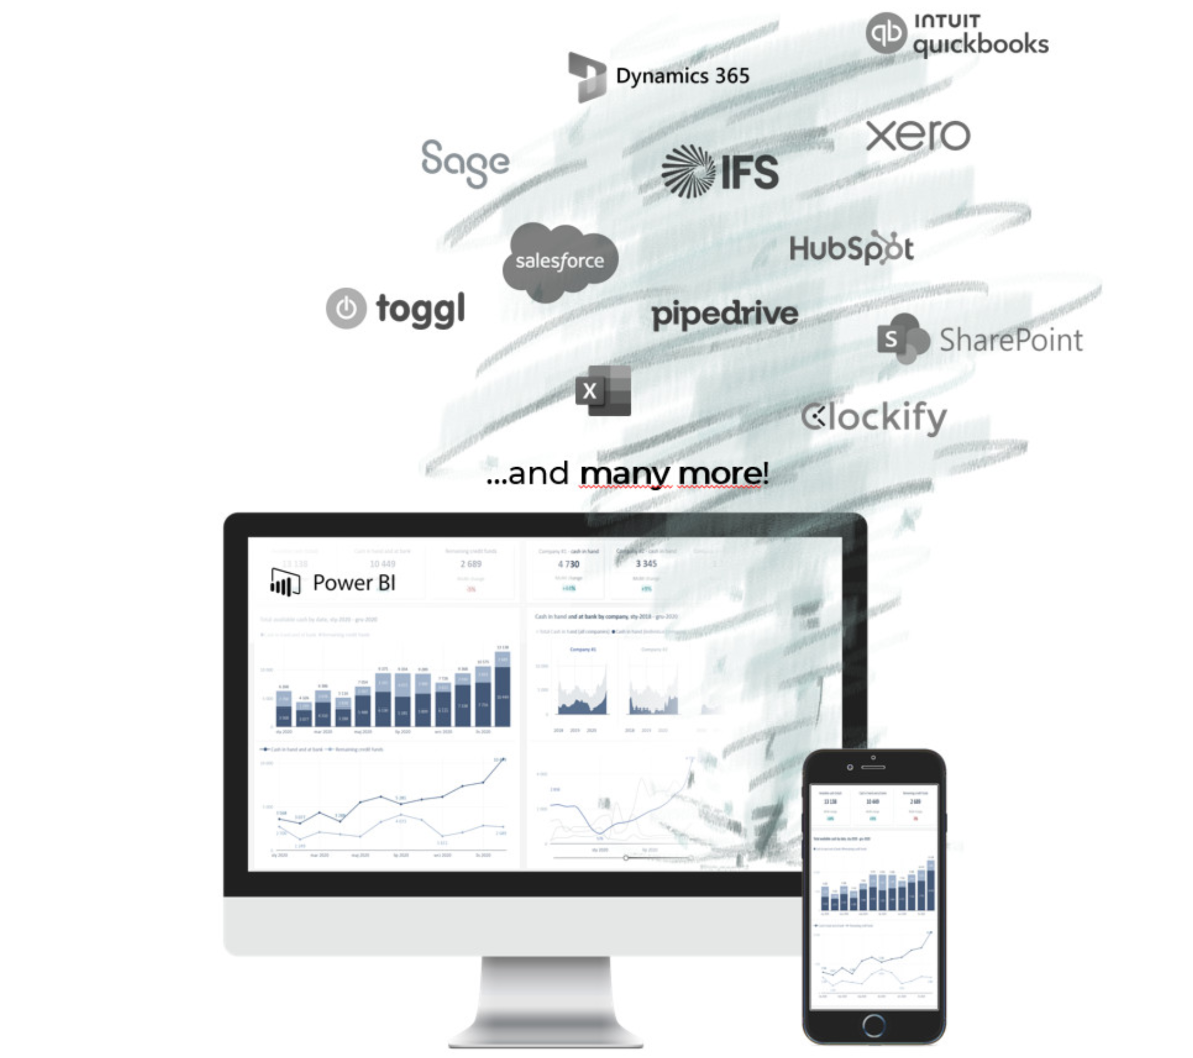
From scattered systems to meaningful insights
Your business data often lives across multiple systems — ERP, CRM, WMS, Timesheets, Excel files, or dedicated tools. We combine it all, turning fragmented information into a consistent and reliable single source of truth.
Thanks to Power BI and our focus on clarity, usability, and storytelling, your team gets not just dashboards — but actionable insights that drive decisions.
We don’t just connect the dots. We organize data to reflect your business reality and support better decision-making. Whether you need to automate reporting, build a modern KPI framework, or simply make existing reports usable again – we help you get there with less manual work and more confidence.
Take a look at the results of our work
IT / Software house / Gamedev
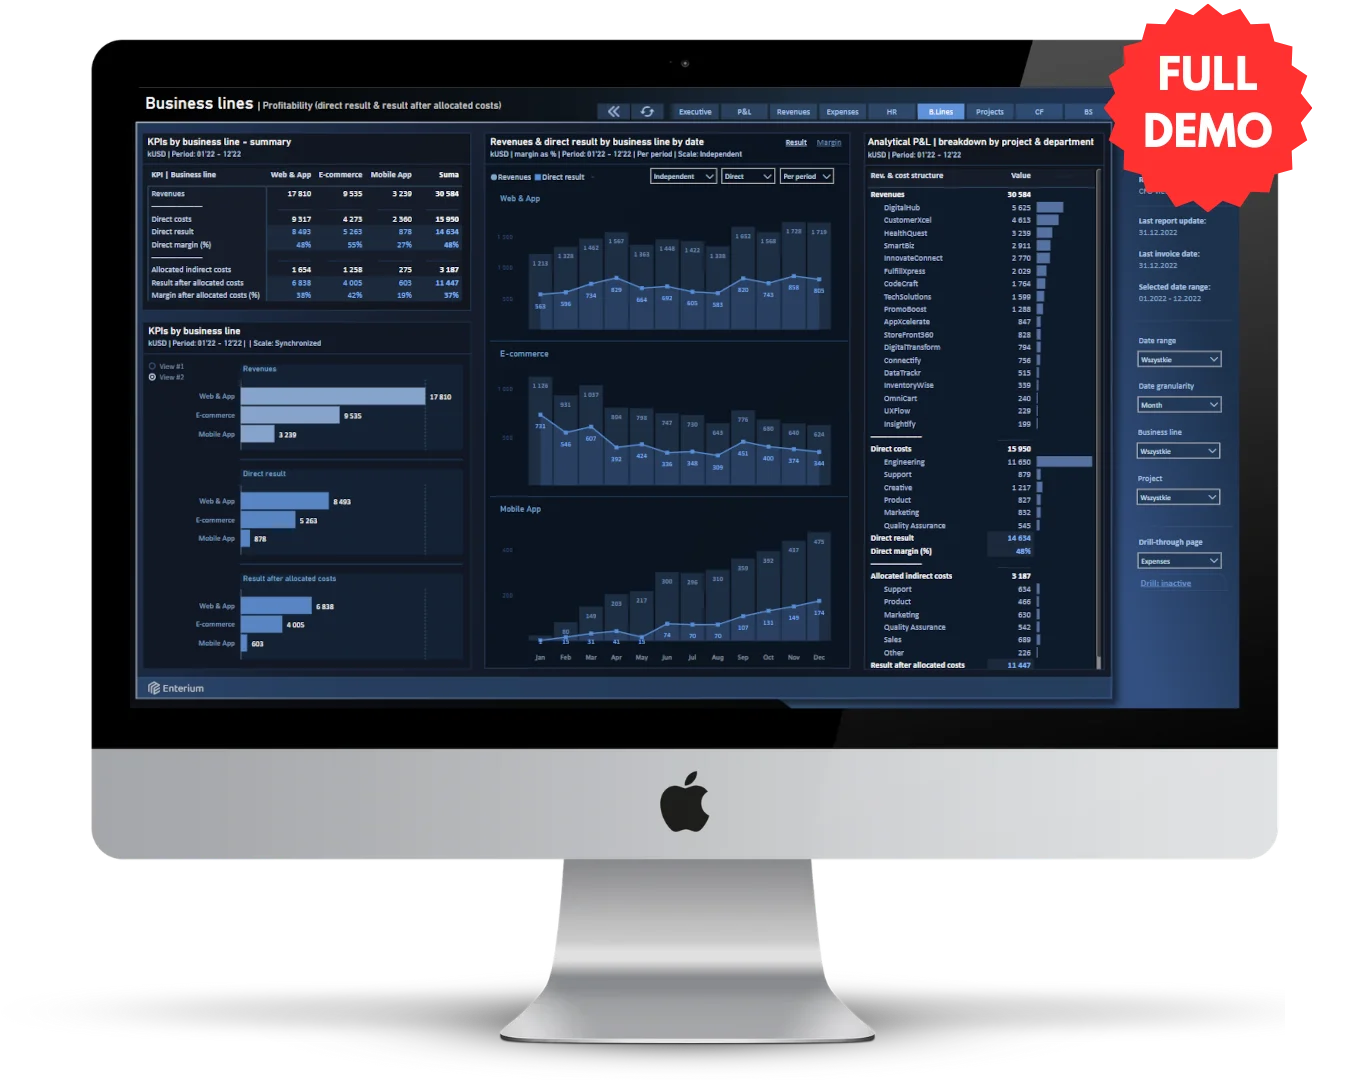
Full BI report demo for IT businesses
A set of dashboards with executive summary, revenue and cost analysis, HR module, business lines and projects margin, cash flow management and budget variance analysis.
Multidimensional KPI analysis
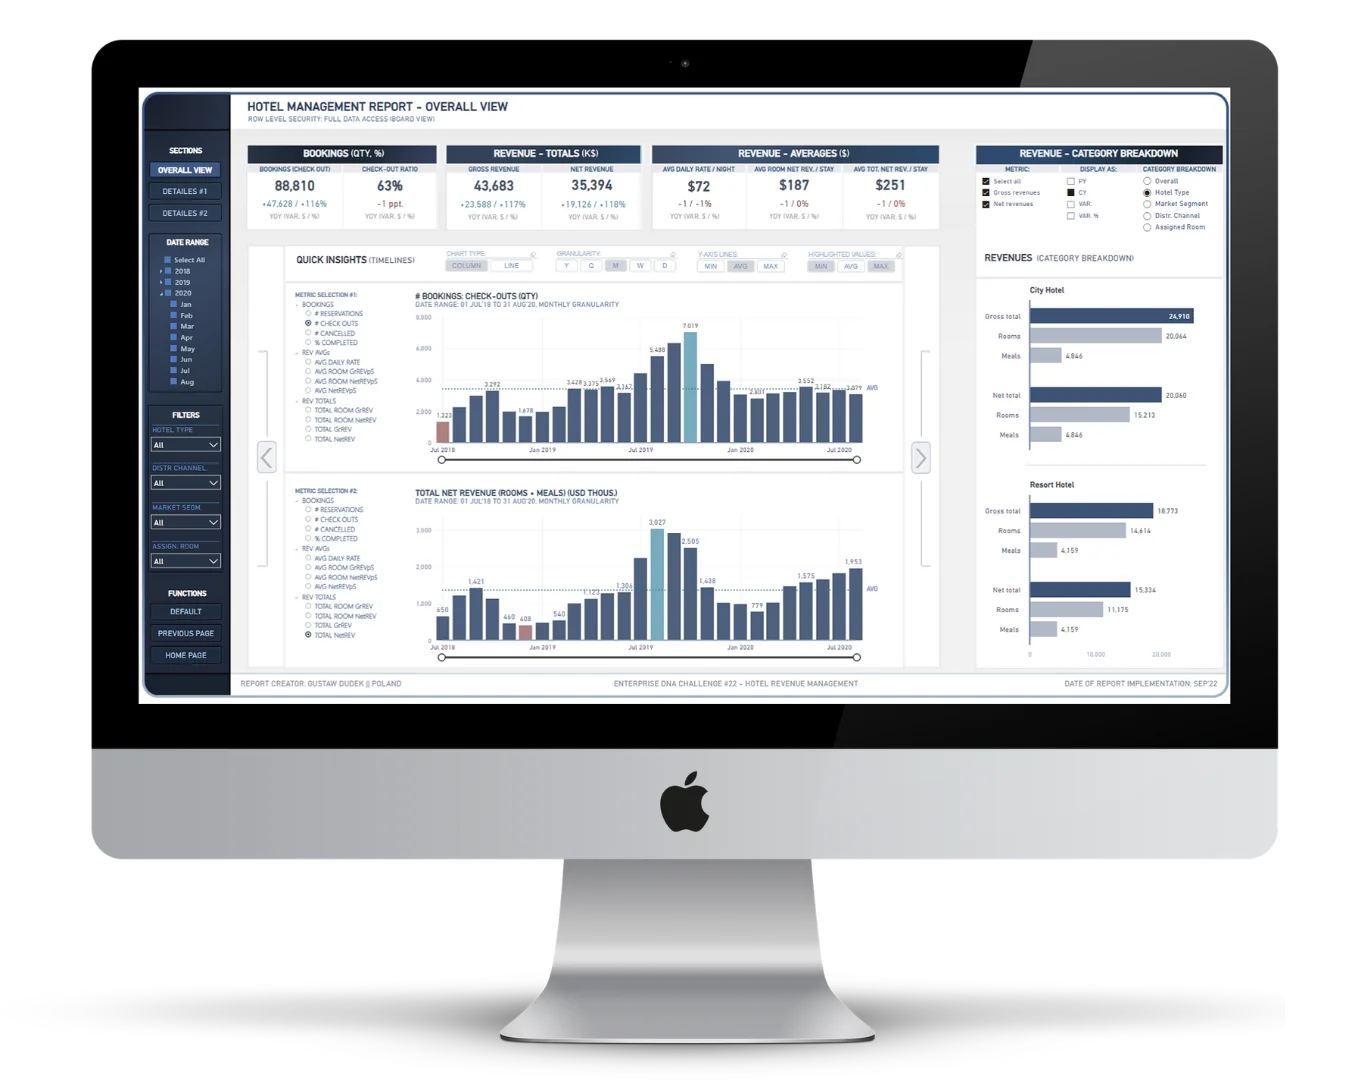
KPI analytics on the example of a hotel company
A set of dashboards for a service company in need of real-time insight into certain industry-specific KPIs, illustrated by the example of a company running a hotel chain.
Marketing reach analysis
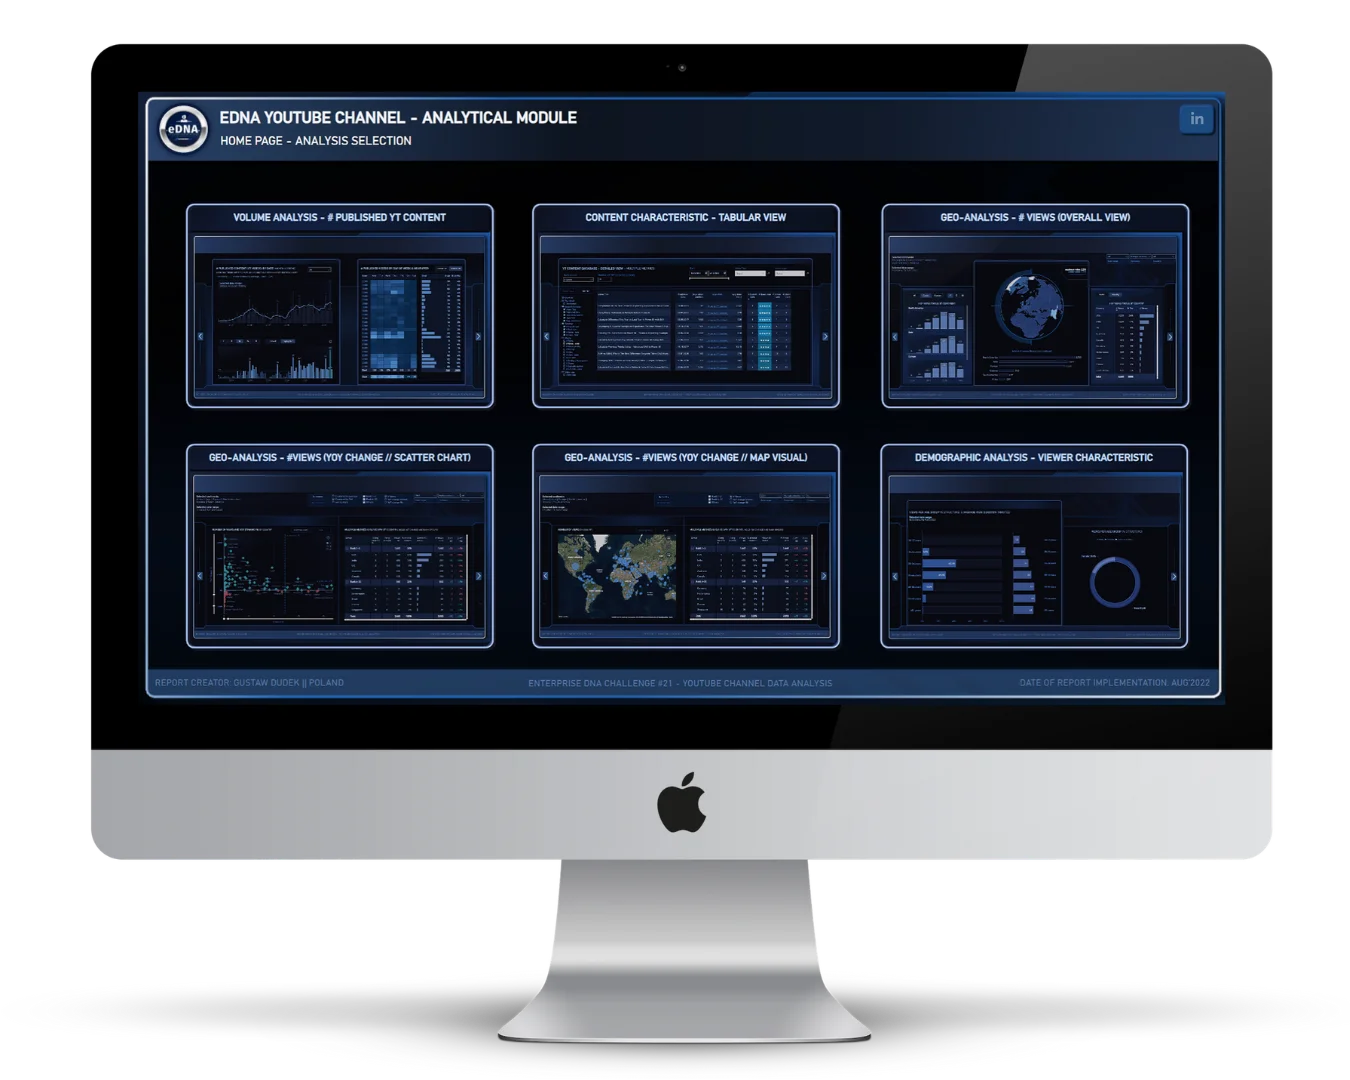
Marketing reach analytics using video content as an example
A sample set of dashboards that allow intuitive tracking and analysis of the audience structure of specific marketing campaigns or content production over time (including even hours).
Market intelligence
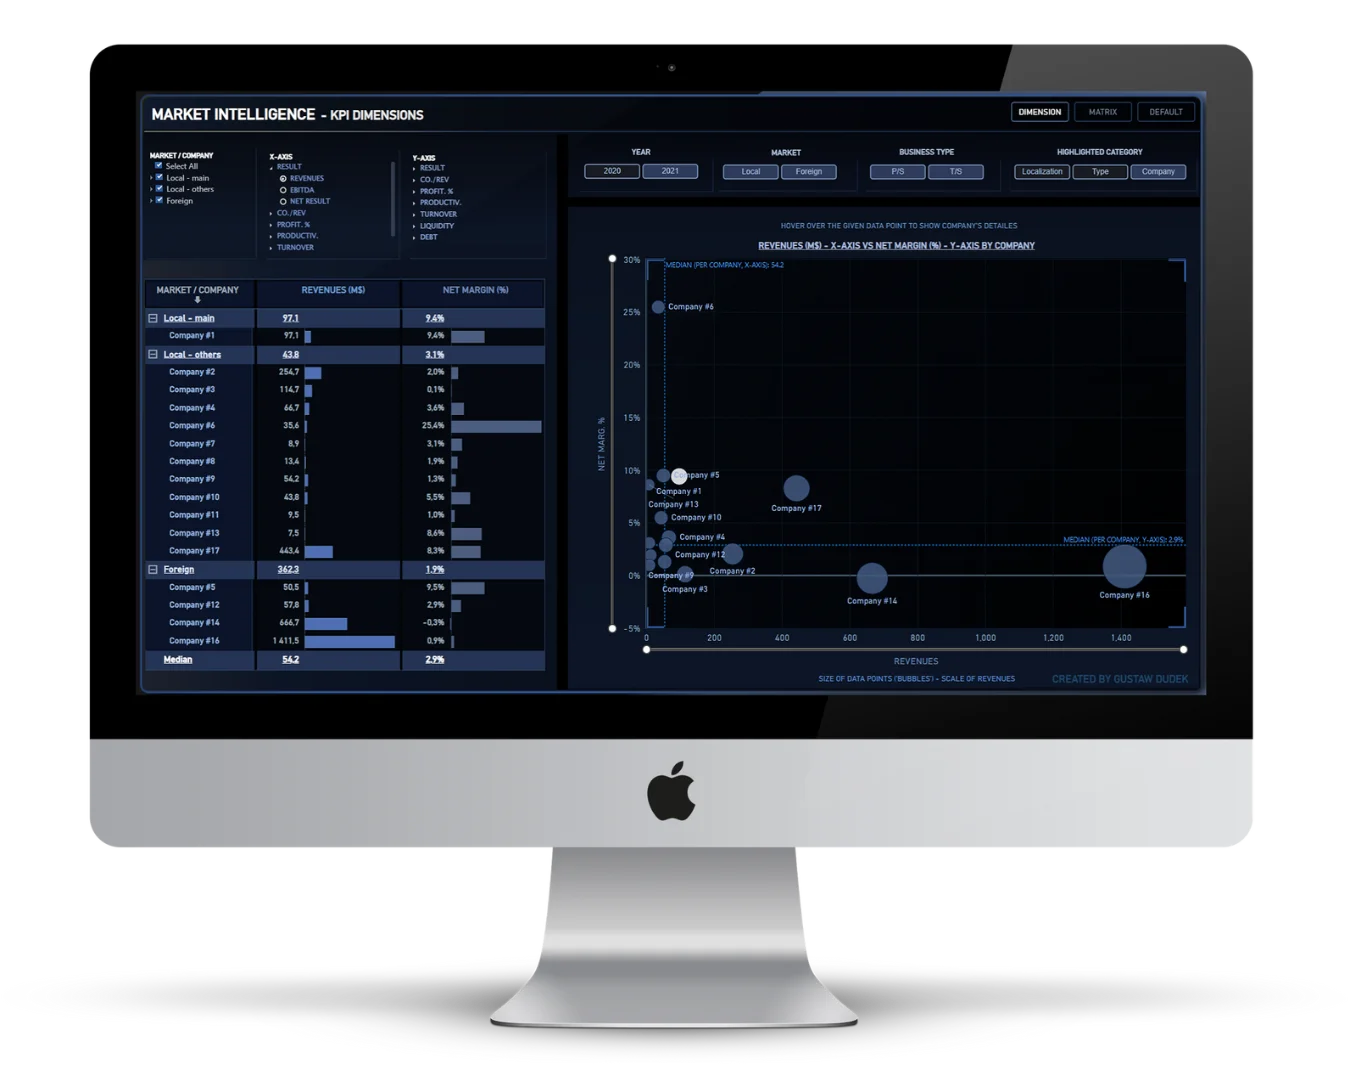
Competitive benchmarking report
A report that provides market intelligence through benchmarking of a company’s financial performance and KPIs to its competitors, in multiple cross sections with the ability to filter in various ways.
Financial KPIs
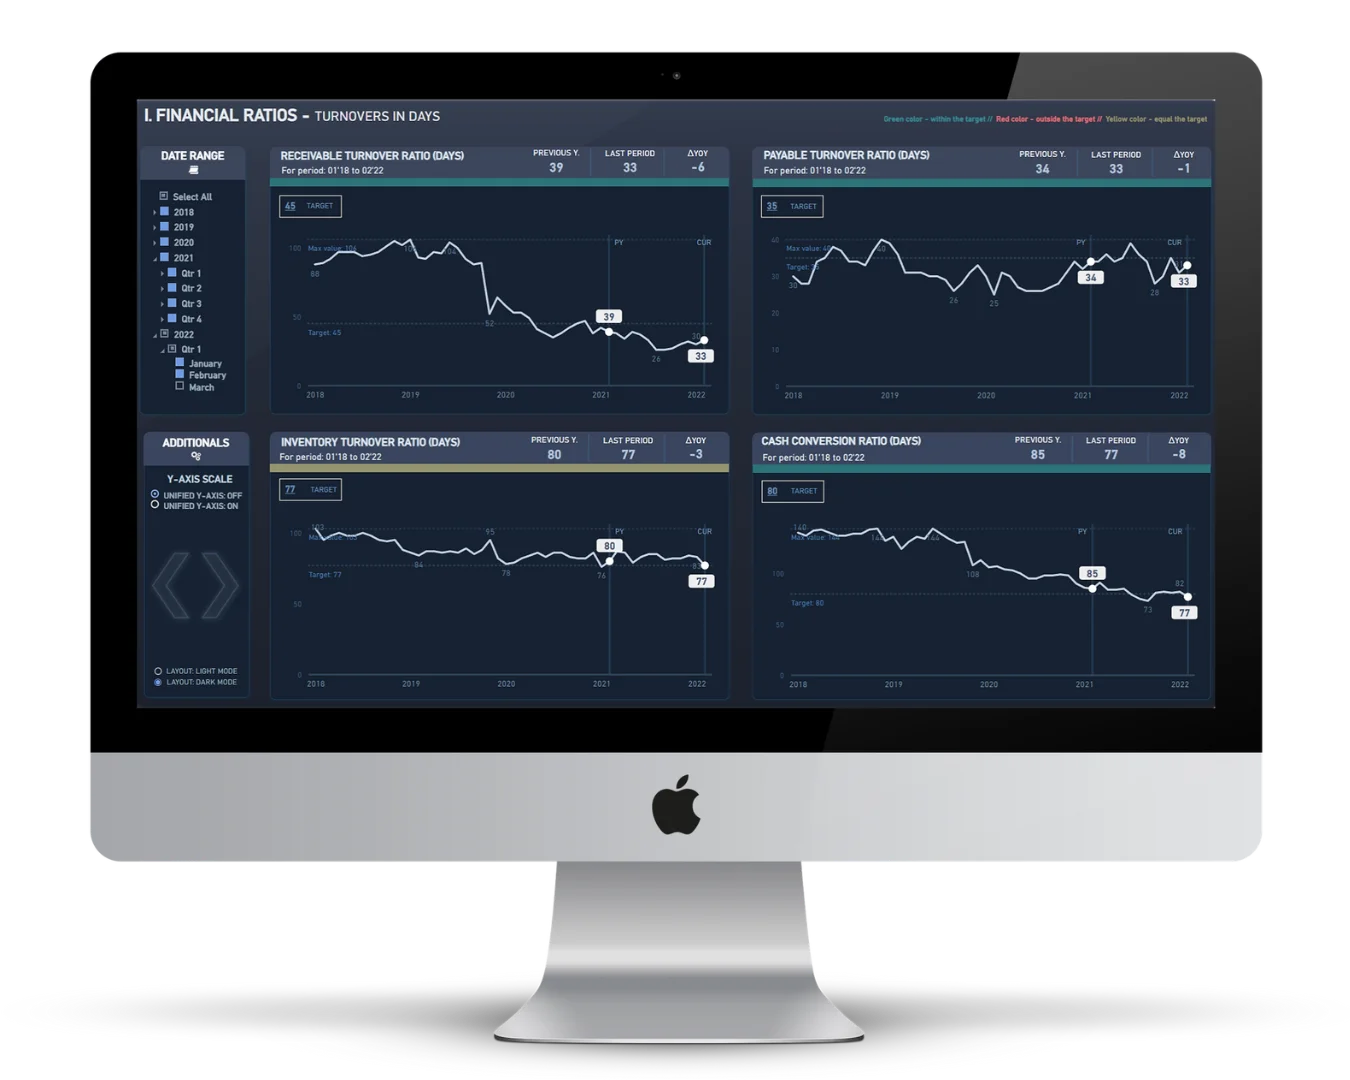
KPI monitoring with reference to targets
A relatively simple report showing the level of performance indicators achieved. At the same time, the dashboard demonstrates the possibilities for visual customization of dashboards and dynamic application of benchmarks.
CRM analytical report
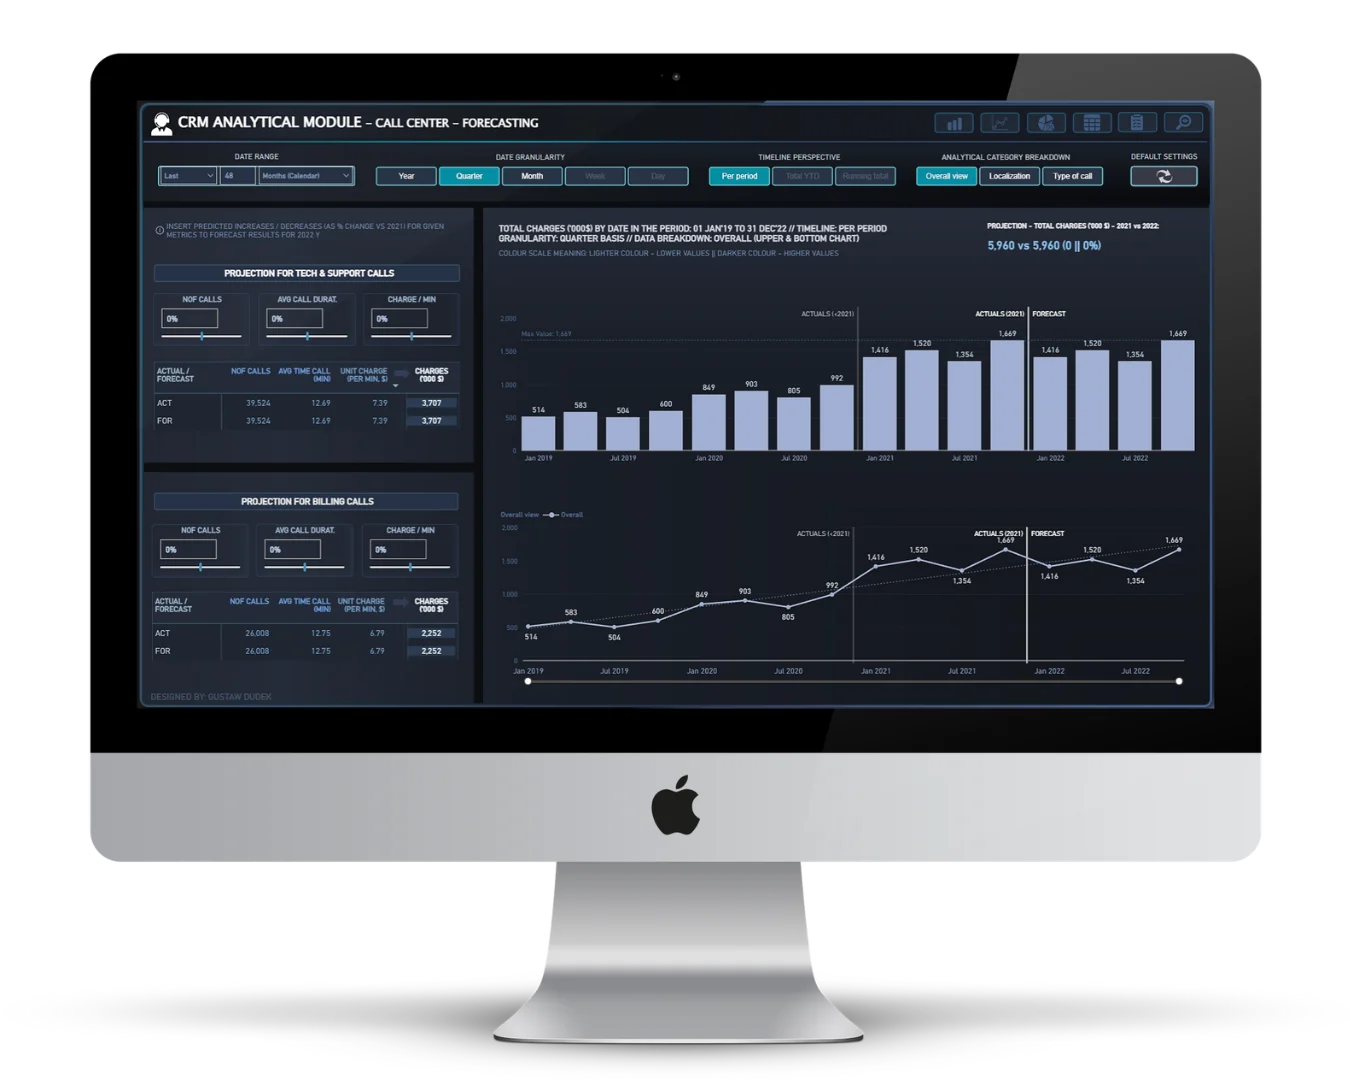
CRM-based analysis of call center activity
Analytical report that allows multidimensional analysis of detailed data on the activity and effectiveness of the sales team / customer care (call / contact center). It illustrates the ability to analyze relatively complex structures and conduct quick forecasts in Power BI.
Emergency services analysis
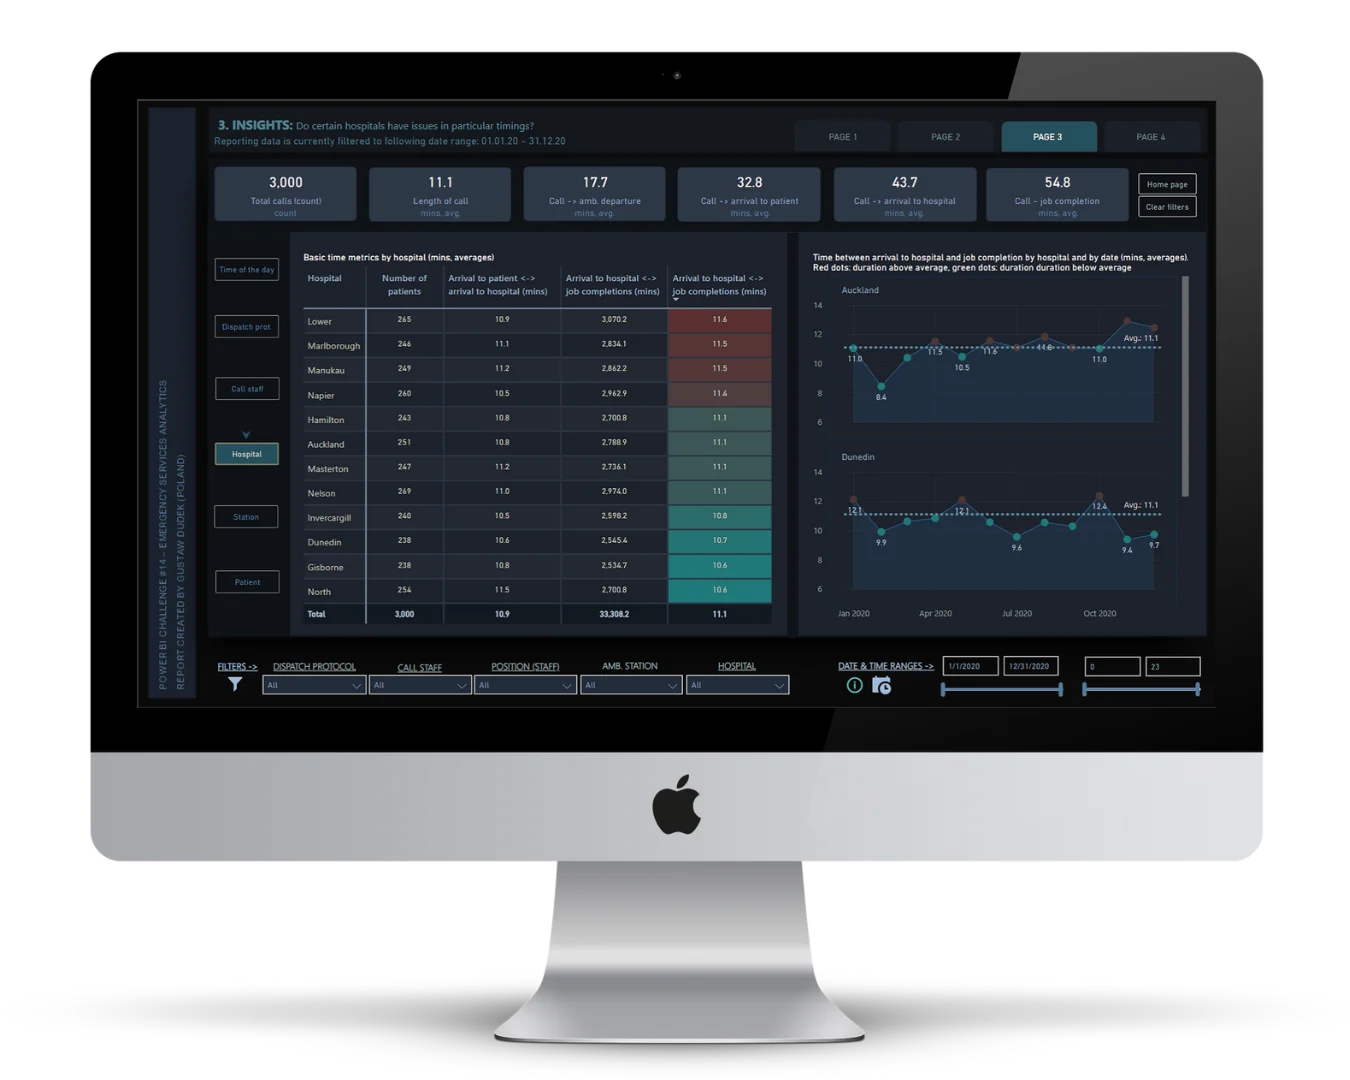
Report for emergency services company
Quite a specialized set of dashboards that allow detailed analysis of emergency medical team activity. The report uses a variety of inspiring methods to visualize operational data.
B2B services profitability
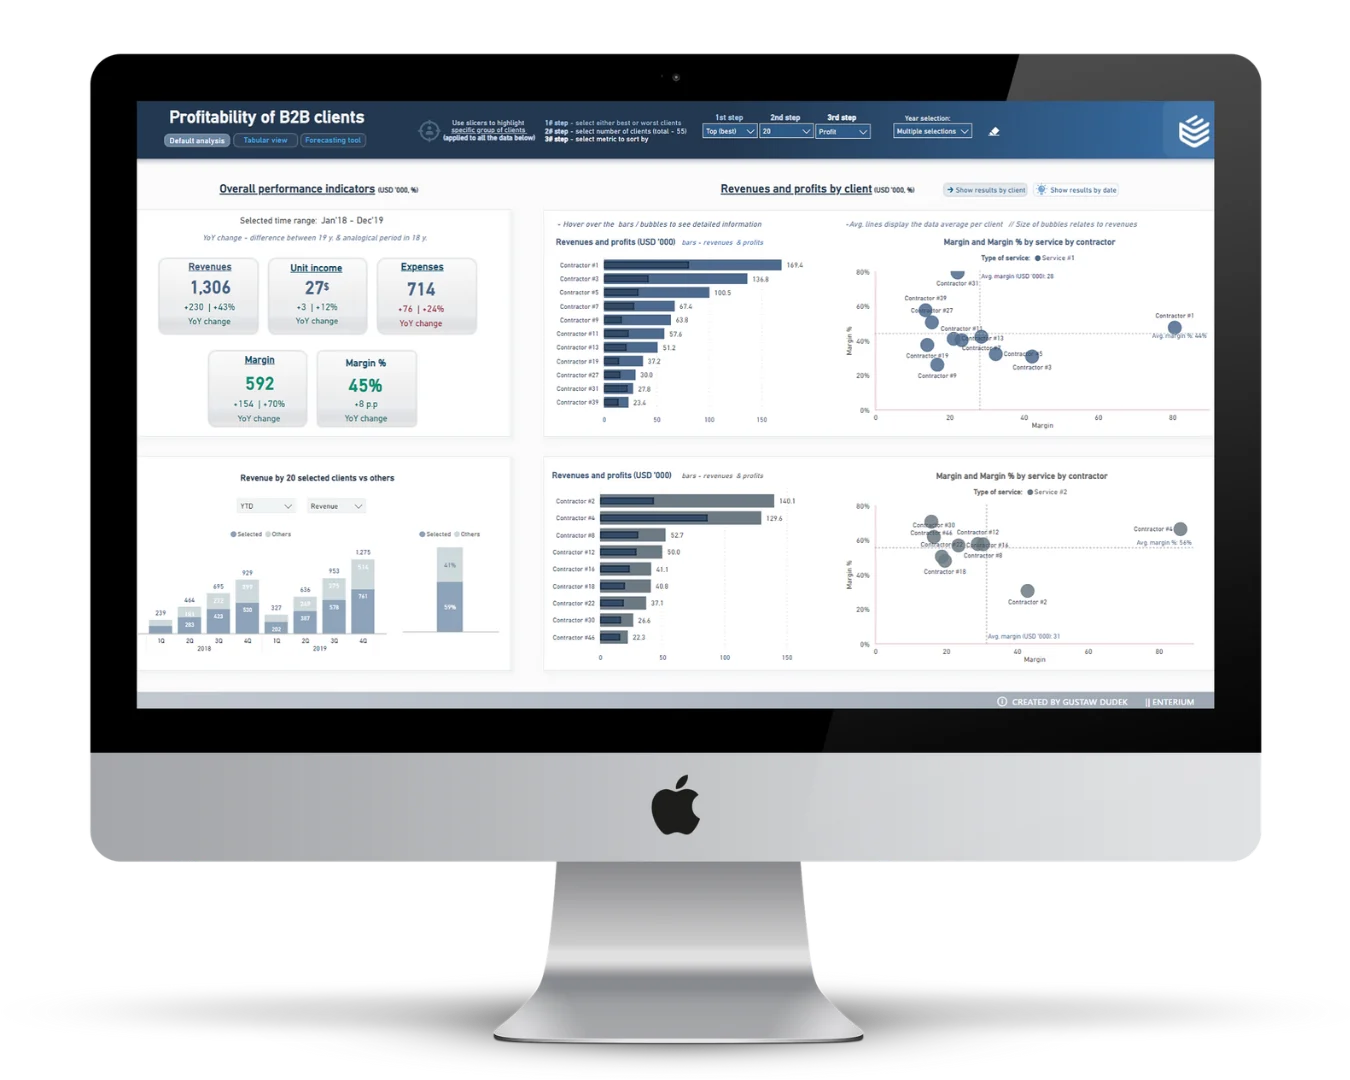
Analytical report on the profitability of providing b2b services
An example of a report that allows comparing the profitability of providing certain business services to customers, with the ability to benchmark and rank them. At the same time, the dashboards allow for quick scenario analysis.
Financial liquidity
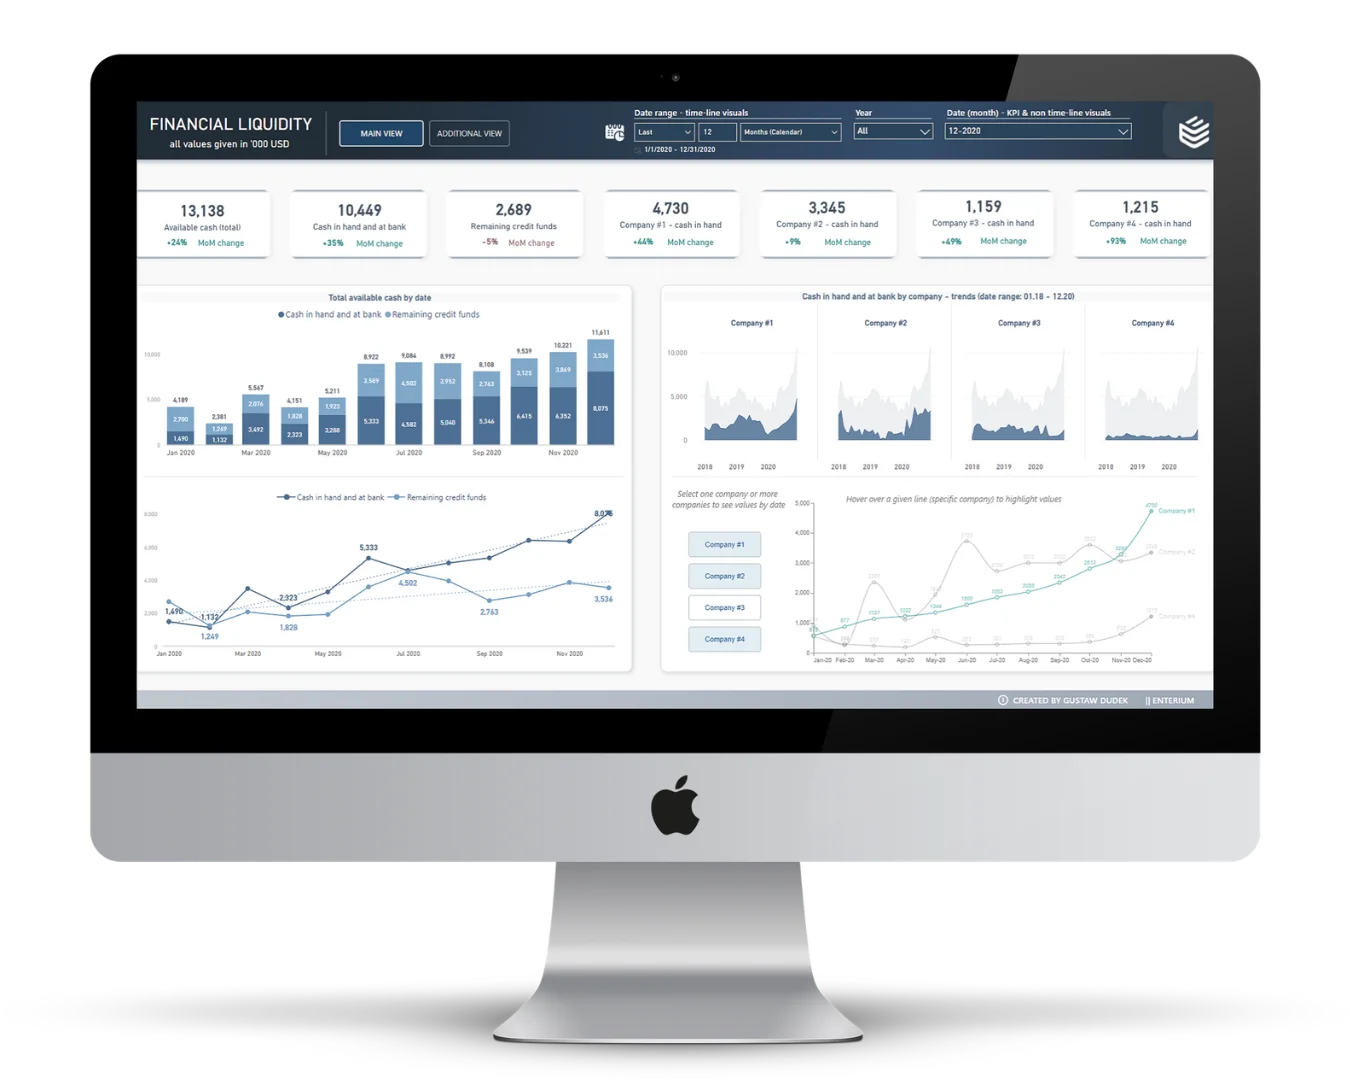
Cash position analytical report
The report allows the company’s cash position to be analyzed on an ongoing basis, along with an illustration of the debt structure and changes in wealth over time. In addition, the report shows how you can freely select the measure to be visualized on the chart.
Full BI report demo for IT businesses
A set of dashboards with executive summary, revenue and cost analysis, HR module, business lines and projects margin, cash flow management and budget variance analysis.
KPI analytics on the example of a hotel company
A set of dashboards for a service company in need of real-time insight into certain industry-specific KPIs, illustrated by the example of a company running a hotel chain.
Marketing reach analytics using video content as an example
A sample set of dashboards that allow intuitive tracking and analysis of the audience structure of specific marketing campaigns or content production over time (including even hours).
Competitive benchmarking report
A report that provides market intelligence through benchmarking of a company’s financial performance and KPIs to its competitors, in multiple cross sections with the ability to filter in various ways.
KPI monitoring with reference to targets
A relatively simple report showing the level of performance indicators achieved. At the same time, the dashboard demonstrates the possibilities for visual customization of dashboards and dynamic application of benchmarks.
CRM-based analysis of call center activity
Analytical report that allows multidimensional analysis of detailed data on the activity and effectiveness of the sales team / customer care (call / contact center). It illustrates the ability to analyze relatively complex structures and conduct quick forecasts in Power BI.
Report for emergency services company
Quite a specialized set of dashboards that allow detailed analysis of emergency medical team activity. The report uses a variety of inspiring methods to visualize operational data.
Analytical report on the profitability of providing b2b services
An example of a report that allows comparing the profitability of providing certain business services to customers, with the ability to benchmark and rank them. At the same time, the dashboards allow for quick scenario analysis.
Cash position analytical report
The report allows the company’s cash position to be analyzed on an ongoing basis, along with an illustration of the debt structure and changes in wealth over time. In addition, the report shows how you can freely select the measure to be visualized on the chart.
Power BI as your decision-support platform
Power BI is the world’s leading Business Intelligence platform – scalable, flexible, and designed to support even the most demanding business environments. Its intuitive interface and reasonable learning curve make it accessible for finance, controlling, and business teams, while offering the depth and versatility needed to build robust reporting and analytics ecosystems.
At Enterium, we take Power BI beyond its standard capabilities – transforming it into a comprehensive decision-support system. We combine automation, advanced reporting techniques, and planning functionalities directly within the BI environment.
Even highly complex data becomes clear and actionable thanks to our focus on usability, data storytelling, and a user experience inspired by the best practices from IBCS and beyond.

Data Collection
Data from multiple sources, delivered automatically
We automate the collection and integration of data from various systems – ERP, CRM, Excel, APIs, and others. This eliminates copy-paste errors, outdated data, and the time wasted on manual data preparation. Whether you rely on complex systems or simple spreadsheets, we create automated flows that keep your reports up to date.
Your benefits:


Data Modeling
Data organized to reflect your business reality
We organize and structure data to reflect the true logic of your business. Combining technical expertise and experience gained across multiple industries, we transform scattered, inconsistent, and multi-source data into a clean and scalable model – ready to serve as a foundation for effective reporting.
From mapping and harmonizing key definitions to orchestrating complex relationships and hierarchies, we make sure your KPIs and reports become consistent, trusted, and decision-ready.
Your benefits:


Report Design
Dashboards that users actually want to use
We design reports that go beyond basic visuals – combining best practices in data storytelling, UI/UX, and advanced formatting techniques inspired by IBCS as well as our own proven methods. This ensures that even the most complex datasets are presented in a clear, interactive, and actionable way, making key insights easily accessible for business users.
Your benefits:


On-demand Reporting
Reports available when and where you need them
We deliver secure, online-accessible reports that are automatically refreshed based on data availability. No waiting for files, no manual distribution – information is always ready when you are.
Your benefits:


Data Democratization
Secure and role-based reporting
With Row-Level Security (RLS) and role-based access, you control who sees what. Different users can access the same report but only see the information relevant to them – ensuring democratized data access without compromising sensitive information.
Your benefits:


Planning & Forecasting
Budgets and forecasts directly inside Power BI
We extend Power BI with native write-back capabilities, enabling budgeting, forecasting, and scenario planning directly within the reporting environment. No more parallel Excel models – everything stays in one integrated system.
Your benefits:


Cloud Architecture
Flexible and secure reporting infrastructure
We adapt to your infrastructure – whether you already use Azure, Power BI Service, or need lightweight data storage solutions. Cloud-based or hybrid, we ensure your reporting environment is scalable, secure, and ready for growth.
Your benefits:


Flexible collaboration models
tailored to your needs and growth stage
Data Consultancy & Strategy
Complete BI Outsourcing
BI Implementation – Task-Based Support
BI Optimization & Standardization
Data Consultancy & Strategy
Strategic consulting supporting the design or optimization of your reporting and analytics ecosystem – combining business, controlling, and technology perspectives.
Typical client situation
- Starting from scratch with Power BI or moving from Excel-based reporting,
- Scaling up or restructuring an existing Power BI ecosystem,
- Reporting does not reflect business needs or lacks consistency,
- Missing governance, KPI framework, or clear reporting processes,
- Lack of internal BI strategy or ownership.
Scope of engagement
- BI maturity assessment – evaluation of current systems, data sources, processes, and team capacity,
- Vision, scope, and goals definition – aligned with business priorities,
- Stakeholder and responsibility mapping,
- Target architecture and data flow design – integrations, pipelines, reporting layers,
- KPI framework and reporting structure concept,
- Process design – governance, automation, access control,
- Technology selection – Power BI and complementary tools,
- Roadmap and implementation plan – priorities, phases, milestones,
- Change management and adoption guidelines,
- Optional: Assistance in early-stage implementation, documentation, and user training.
How we deliver
We work as your strategic BI partner — combining analytical consulting with real-life reporting experience.
Typical delivery includes
- Discovery workshops with key stakeholders and report users,
- Iterative consultations and working sessions,
- Preparation of recommendations, concepts, and actionable documentation,
- Optional: Training, pilot implementations, and ongoing advisory.
Projects are usually delivered as fixed-price or time & materials consulting engagements depending on scope and timeline.

Strategic BI roadmap

Improved data governance

Optimized KPI framework

Foundation for scalable reporting
Complete BI Outsourcing
Full-service outsourcing of the Business Intelligence function – covering reporting, data modeling, maintenance, and ongoing development of Power BI environments. We act as your external BI team, taking full responsibility for the effectiveness and continuous improvement of your reporting ecosystem.
Typical client situation
- No internal BI capacity or limited availability of Power BI specialists,
- Rapid growth requiring scalable reporting support,
- Controllers or finance teams overwhelmed by reporting tasks,
- The need to outsource reporting and analytics as a service,
- Seeking a stable, long-term partner responsible for day-to-day reporting operations and BI development.
Scope of engagement
- Maintenance and continuous improvement of Power BI reports,
- Data modeling and automation of data flows,
- Development of new dashboards and reporting features,
- Ongoing optimization and standardization of existing reports,
- Implementation of best practices in data storytelling and UX,
- Support for finance, controlling, and business teams in reporting processes,
- Regular knowledge transfer and documentation,
- Optional: Continuous advisory and improvement recommendations.
How we deliver
We provide a dedicated BI team that acts as a seamless extension of your organization.
Typical delivery includes
- Establishing clear governance and reporting processes,
- Regular delivery cycles – agile and milestone-based,
- Day-to-day communication and collaboration with key stakeholders,
- SLA-backed ongoing support, ad-hoc tasks, and continuous development.
The service is typically delivered under a subscription model (retainer) with a predefined scope and flexibility to adjust capacity as your business evolves.

Continuous development with clear deliverables

Predictable and scalable cost

No recruitment or onboarding needed

Guaranteed SLA for stability and peace of mind
BI Implementation – Task-Based Support
Targeted, project-based support focused on delivering specific Power BI solutions. We help organizations design and implement individual dashboards, sets of reports, or automate selected data flows – without engaging in full outsourcing.
Typical client situation
- Need to develop specific dashboards for management, operations, or controlling,
- Rapid growth requiring scalable reporting support,
- Need to automate selected reporting processes or migrate reports from Excel,
- Support for the internal BI or controlling team during peak workloads,
- Requirement for a one-off, high-quality delivery without long-term commitment.
Scope of engagement
- Design and implementation of Power BI dashboards tailored to business needs,
- Data integration, modeling, and preparation for specific reporting purposes,
- Report optimization – UI/UX, data storytelling, interactivity,
- Automation of selected data pipelines,
- Integration of advanced features (e.g., scenario analysis, budgeting modules),
- Optional: Training, documentation, and knowledge transfer for internal teams.
How we deliver
We operate in a highly focused, agile model – delivering end-to-end reporting solutions tailored to client expectations.
Typical delivery includes
- Initial workshop or scoping session,
- Business and technical requirements gathering,
- Iterative development with ongoing client feedback,
- Delivery of final dashboards and handover workshops.
We typically work on a time & materials basis, ensuring full flexibility during development. In cases where data sources are well-prepared, business logic is clearly defined, and dashboard complexity remains moderate, we may offer fixed-price delivery for selected parts or the entire project.

Effective, targeted BI delivery

Scalable support on demand

Business-ready dashboards delivered

Full control, no lock-in
BI Optimization & Standardization
We improve and professionalize existing Power BI environments – addressing issues related to data models, reporting logic, clarity, visual consistency, and user experience. Our goal is to turn underperforming or hard-to-use reports into effective decision-support tools.
Typical client situation
- Power BI is already in use but reports are underperforming,
- Reports are unclear, slow, or difficult to maintain,
- Inconsistent KPIs or disconnected data sources,
- Lack of reporting standards and storytelling principles,
- Users don’t trust reports or avoid using them in decision-making,
- The need to refresh and modernize existing reporting solutions.
Scope of engagement
- Audit and assessment of current Power BI environment,
- Redesign and optimization of existing dashboards,
- Alignment with business logic and KPI framework,
- Implementation of data storytelling, UI/UX best practices, and reporting standards,
- Optional: Data model restructuring and performance tuning,
- Optional: Reporting guidelines and training for internal teams.
How we deliver
We combine technical, business, and design expertise to upgrade and standardize your existing reporting environment.
Typical delivery includes
- Assessment and analysis of existing reports,
- Iterative redesign and optimization based on client feedback,
- Implementation of visual and reporting standards,
- Optional: Knowledge transfer and documentation to ensure sustainable usage.
Projects are usually delivered on a time & materials basis, especially when the scope depends on the quality and complexity of the current reporting environment. For well-defined and limited-scope projects, we can offer a fixed-price model.
Make underused dashboards valuable again

Improve visual clarity and strategic insight

Increase user satisfaction and report adoption
Align reports with current scale and goals
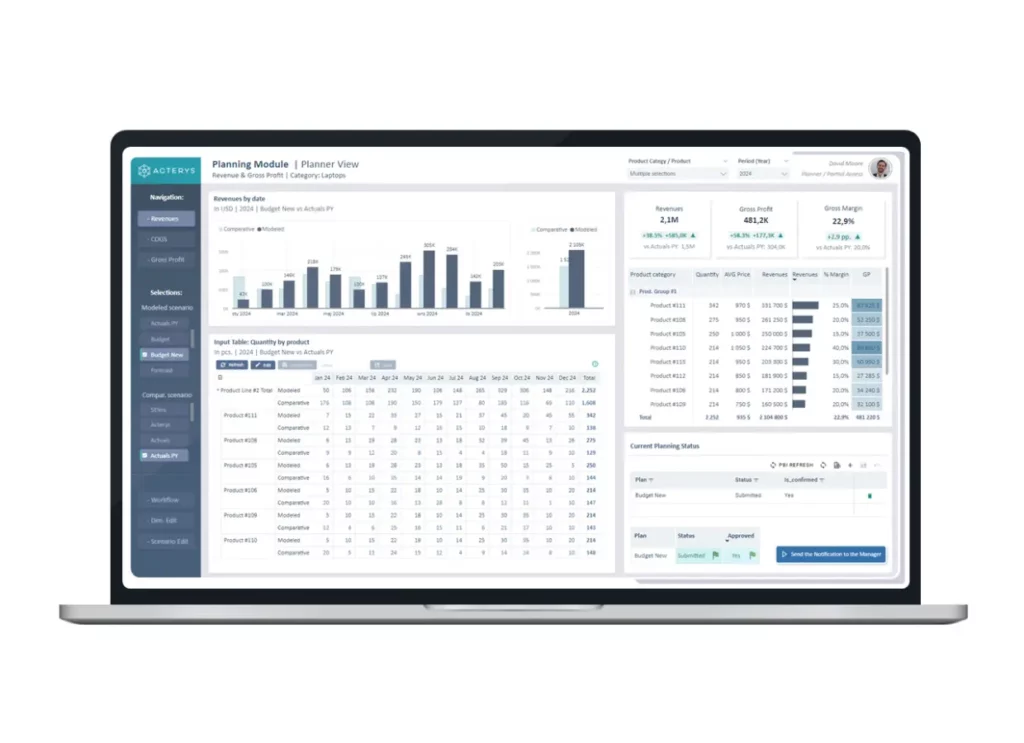
Planning, Forecasting & Budgeting – Directly in Power BI
We extend Power BI beyond reporting — enabling full planning, budgeting, and forecasting processes inside your dashboards. With direct data entry (write-back) and real-time simulations, you can manage financial and operational planning without leaving your reporting environment.
Finance, controlling, and business teams can now adjust assumptions, run rolling forecasts, and prepare detailed budgets directly in Power BI – without relying on disconnected Excel files or external tools. This brings agility, transparency, and structure to your planning processes.
Integrated planning & budgeting
Plan revenues, costs, and investments directly in Power BI – with live data, always connected to your reporting layer.

Forecasting & scenario simulations
Run real-time forecasts, adjust assumptions, and model multiple scenarios – all within your dashboards.
Automated consolidation and allocations
Speed up closing processes with built-in allocation logic and automatic data aggregation across entities.
Collaboration & transparency
Bring planning closer to business users. Enable collaborative planning workflows, approvals, and shared ownership of forecasts.
Not sure where to start? Let’s talk.
Whether you’re designing your first dashboards or trying to improve an existing reporting environment – we can help you find the most effective way forward.
We work transparently and we care about your trust
In case it’s your first time dealing with business intelligence solutions, please read the answers to questions that often arise at the beginning of the journey. If you have any additional questions, don’t hesitate to reach out to us.
Why should I opt for Power BI and not another technology solution?
Power BI is a cloud-based BI service that was released by Microsoft in 2014. It leverages years of experience in MS Excel, SQL Server, Access and continually, and for good reason, is indicated as a top#1 BI solution in numerous market reports.
One of the most important advantages of Power BI is that it is able to pull data from almost any source – not just a selected data ecosystem or technology. In addition, it is relatively easy to use from the user side of reports and allows them to be shaped quite freely for the business or operational needs of the organization.
It also allows you to share selected reports or sections of reports with other users, so your entire organization can be data-driven without compromising the security of your data.
And last but not least, it is highly cost-effective – both in terms of implementation and subsequent maintenance.
How do I know my information is secure?
Our team has an information security policy with appropriate IT monitoring, and our teams are well-equipped to use technology and tools for sensitive information.
In addition, with our services we improve the security of your organization’s data and information by reducing the number of files or emails sent electronically to a total minimum using secure technology equipped with multi-step authentication.
All data captured in Power BI is encrypted by default using Microsoft-managed keys. Customer data stored in Azure SQL databases is fully encrypted using Azure SQL Transparent Data Encryption (TDE) . Customer data stored in Azure BLOB Storage is encrypted using Azure Storage Encryption. The Power BI Premium license additionally allows you to use custom keys to encrypt stored data that is imported into the data store.
Why do I even need BI-class reporting? We have an ERP system and probably sufficient reports in Excel spreadsheets.
That’s what many managers think until they see in practice how useful, fast and accessible their reports can be using business intelligence technology.
This is due to the great ease with which they can get the information they need at any given time, at any level of detail – often with just a few mouse clicks or finger taps on a smartphone screen.
However, BI isn’t just about the front-end, it’s also about everything that goes on in the background – which means automating the collection, combination and processing of data. Consider how much time you and your team will save in creating analytical reports, summaries and analyzing them by paying off your technology debt in the reporting & analytics area.
Is it expensive to implement and maintain a business intelligence reporting ecosystem based on Power BI?
The Power BI solution is highly cost-effective. The cost of maintaining the solution itself depends mainly on the number of users of the target reports. The cost of a license for 1 user is $10-20/month (depending on the level of complexity of the reporting back-end).
On top of that, of course, there is the one-time cost of implementation, i.e. the overall design of the report architecture, data model and user interface. However, the development work and thus the cost can be spread over time. This part of the cost is a function of the company’s reporting and analytical needs, the level of complexity of the business model and data structures. However, thanks to the flexibility of the technology behind Power BI and affordable integrability with external systems and databases, the implementation costs are not comparable to the deployment of complex systems such as ERP, xP&A or EPM/CPM.
Once BI-class reporting is implemented, do I need to hire experts to maintain and grow this ecosystem?
You don’t need to increase employment. Who knows, you may even find that you can optimize your current resources. A correct BI implementation is most often combined with the automation of a significant part of analytical and reporting processes. This way your team won’t have to waste time unproductively transferring data from one spreadsheet to another.
We often enter into a partnership with our clients after a period of fundamental implementation, helping them gradually develop and optimize their reports, respond to new analytical and managerial needs, provide continuous QA and optimize further processes.
Exploiting our extensive experience in finance and strategy, we also provide synergistic consulting services, including ongoing financial controlling. You then have your comprehensive analytical needs provided under one roof.
Do I need a data warehouse to implement a business intelligence solution?
Not necessarily. It all depends, of course, on individual needs and where the data is currently being processed. Data from sources (e.g., your accounting system, ERP, CRM, workflow applications, spreadsheets) can feed the BI reporting ecosystem directly, without going through a big data warehouse. If you decide you need one, however, or if it would simply be more efficient for whatever reason, you can start by using so-called Datamarts, which are relatively low-cost data storages, based on the Azure SQL cloud.
Of course, we can help you on both simplified data flow and slightly more complex data warehousing solutions. However, this does not mean an exponential increase in the cost of deployment – today, these are effective solutions whose cost of maintenance increases as the volume of data increases.
Enterium Knowledge Academy
Practical insights on reporting, data visualization, and creating a data-driven culture.

Build the right processes and structures – then scale with BI
Strong controlling processes and a clear analytical backbone are often the first step toward better reporting.
If that’s your current priority, explore our Controlling Excellence services.