Move your reports from Excel to Power BI - see why it's worth it!
4 min read
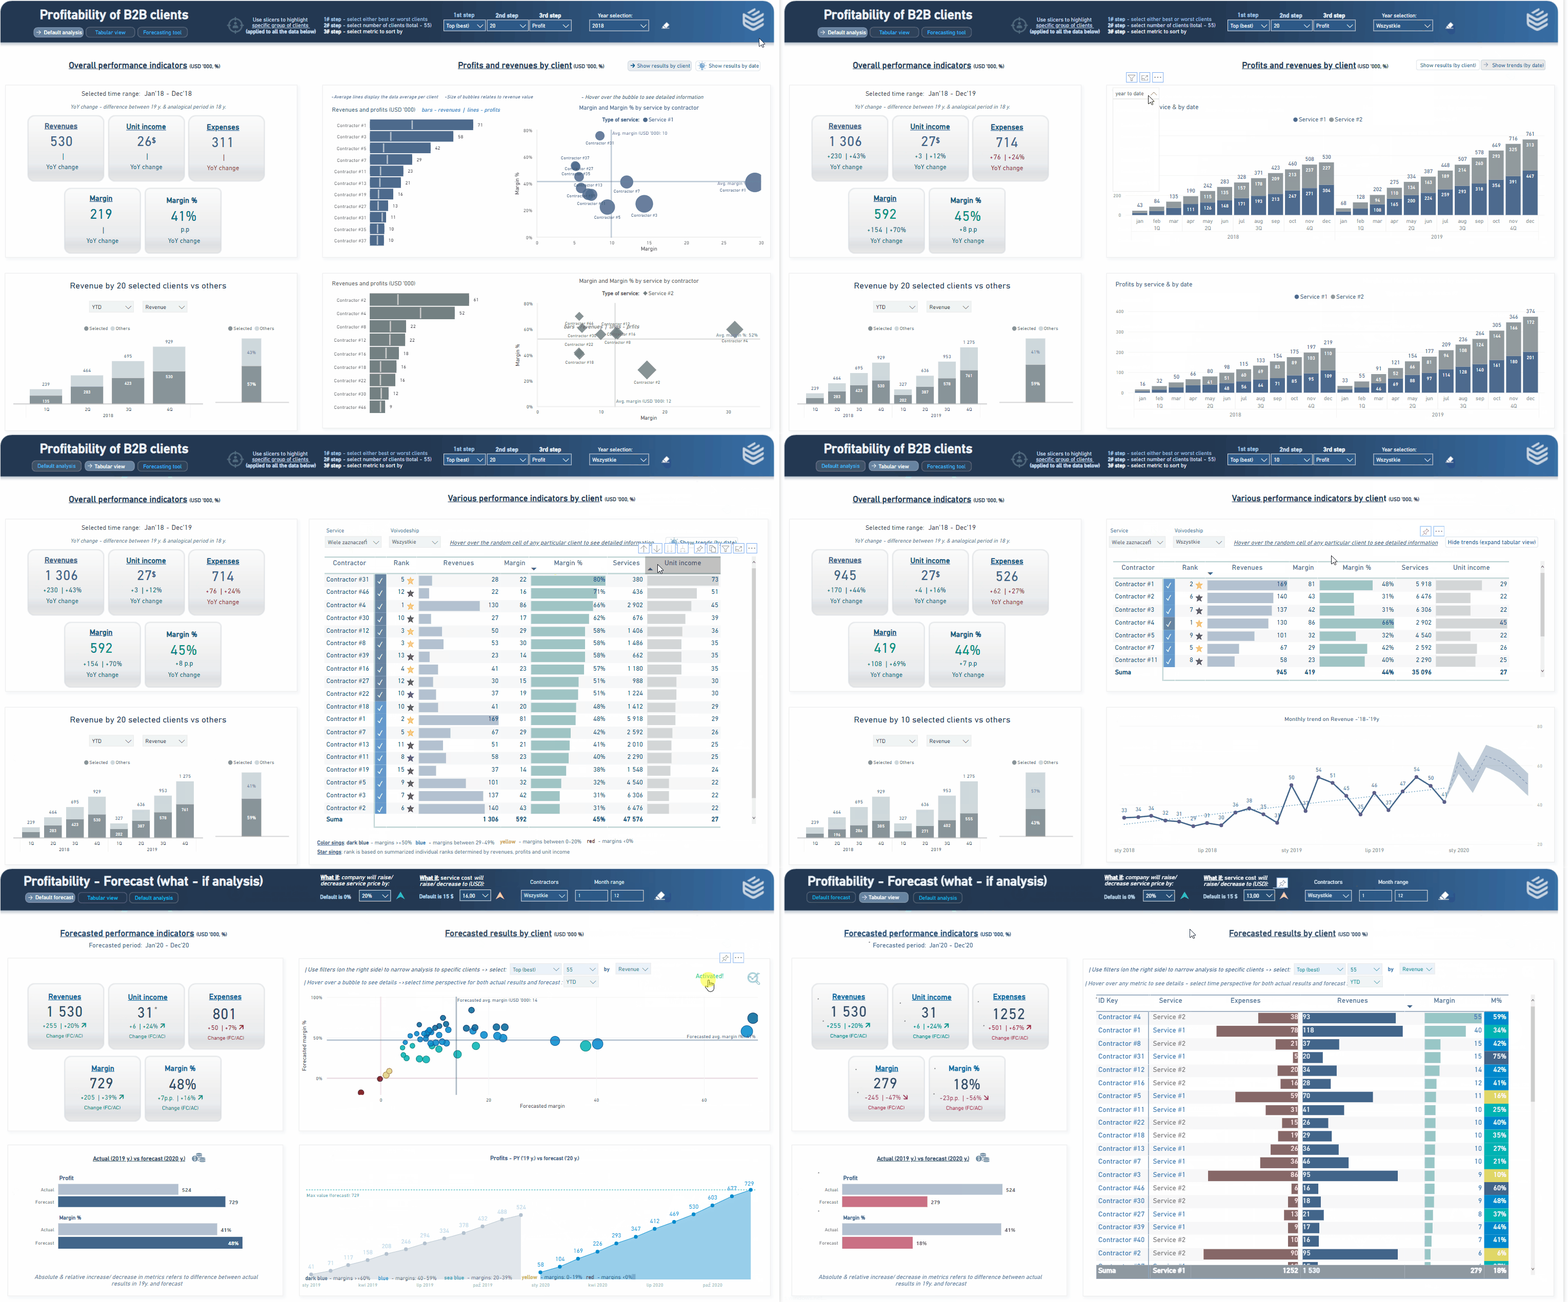
Are you starting to feel like your company is producing too many Excel files to keep track of? Are Excel’s limitations becoming increasingly apparent, making it harder to work with data efficiently? Perhaps your company has grown to the point where this basic Microsoft Office tool is no longer sufficient? Then it’s time to rethink your approach to data processing and reporting. Learn how to recognize when Excel is no longer enough—and why switching to Business Intelligence tools like Power BI is a smart move. Microsoft Excel is a powerful tool that serves well as a data repository with basic reporting capabilities, especially for smaller businesses. Over the years, Excel has evolved with several advanced add-ins, including: This evolution enables Excel to support basic and some intermediate reporting needs. However, as businesses scale and the volume of data, data sources, and report users increases, Excel becomes less effective. When that happens, it’s time to ask the tough question—do you need a more advanced and professional reporting solution? Employees spend 36% of their time manually searching for and organizing information. Additionally, 44% of their time is spent reviewing files that don’t contain the needed data. (CMS Wire) Wondering how to know if Excel alone is holding your team back? Here are 7 clear warning signs: Data should serve your organization—not create problems. If your company hasn’t yet acknowledged the inefficiencies of Excel-based reporting, it’s time to take a step back and consider how much valuable time your team is losing on non-productive tasks that offer no real business value. That’s when you need a smarter approach—and Power BI is your answer. Power BI, a Microsoft solution, is a revolutionary platform for data processing, visualization, and real-time analytics. It works both on-premises and in the cloud, enabling seamless integration of data from various sources—accounting software, databases, spreadsheets, and web applications. Unlike “boxed” BI modules bundled with popular accounting software, Power BI allows you to build fully customized reports from scratch. It also makes sharing reports—or specific components—easy with both internal teams and external partners. Excel’s limitations become most apparent when you try to visualize data, merge data sets, or create interactive dashboards and charts. Effective data visualization is key to drawing actionable insights—and those insights drive operational and strategic decisions. That’s why it must be done right. According to Gartner, poor data quality costs organizations an average of $15 million per year. (Gartner) By leveraging Microsoft Power BI, you gain far more capabilities. You can conduct deeper analyses, search for insights faster, and present results in a more clear and compelling way. Imagine needing to know the price and margin for a product sold to a specific client three months ago. How long would it take you, your accountant, or a team member to find or calculate that? With well-designed reports and data flows, you can get that answer in just a few clicks. Power BI works with integrated data from across your organization (and external sources) while ensuring high data security. It centralizes your data—no more scattered, disconnected Excel files. Earlier, we listed 7 signs that it’s time to move beyond Excel. Now let’s summarize 7 major advantages of Power BI over traditional spreadsheets. Comparison: Excel Report More than 5 million users already subscribe to Power BI. (Microsoft) Excel and Power BI were built for different purposes. Excel excels (pun intended) at organizing data, performing calculations, and creating basic tables. In contrast, Power BI is designed for businesses with advanced analytical needs. Power BI is ideal for working with large datasets, interactive data analysis, visual storytelling, and team collaboration. It integrates data from multiple sources and enables informed decision-making. If that’s your company’s direction, read our previous article to learn more – What is Power BI? Digital transformation in business intelligence and controlling doesn’t have to be expensive—especially if your organization isn’t yet a large corporation. Power BI is a cost-effective solution that can significantly improve data flow, reporting efficiency, and empower your team to make informed decisions using a single, integrated source of truth. Still, we recommend working with BI professionals to ensure proper implementation. Contact us—we’d be happy to guide you through this exciting transformation!
Move Your Reports from Excel to Power BI – See Why It’s Worth It!
First signs that Excel is no longer enough

When Excel isn’t enough, move your reports to Power BI
Power BI vs Excel – Key Advantages


Different Tools for Different Needs
High Business Value at a Low Cost
We are increasing company value, for real


